Building Creative Reports
Last updated: January 17, 2025
Default Reports
When creating a new MagicBrief account, your Insights workspace will be pre-populated with these default reports to help get you started with creative analysis.
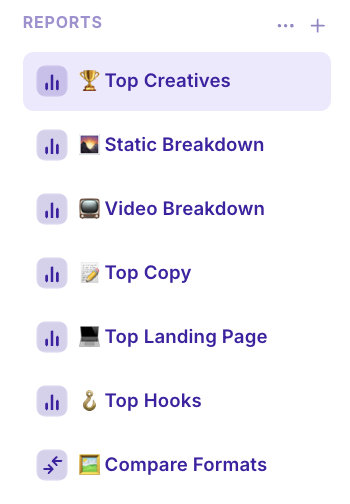
🏆 Top Creatives - A report of the top spending and top ROAS ads in your account
🌄 Static Breakdown - A report of the top static ads in your account (including click and buy scores to evaluate creative performance)
📺 Video Breakdown - A report of the top video ads in your account (including hook, hold, click and buy score to evaluate creative performance)
📝 Top Copy - A report of the top performing ad copy in your account
💻 Top Landing Page - A report of the top performing landing pages in your account
🪝 Top Hooks - A report of the top hooks in your account, sorted by Hook score & Thumbstop
🖼 Compare Formats - A comparison report to see the performance of different creative types
Read on below to learn the different types of MagicBrief reports, and get a guide on the key features and functionality.
Custom Reports
Build out your own custom reports with ease.
Overview Reports
Overview Reports includes all your basic report building functionality and allows you to see the performance of individual ads / elements of ads.
These reports are great for regular performance updates, reporting on specific campaigns, and finding opportunities for iteration and optimisation in your ad account.
Comparison Reports
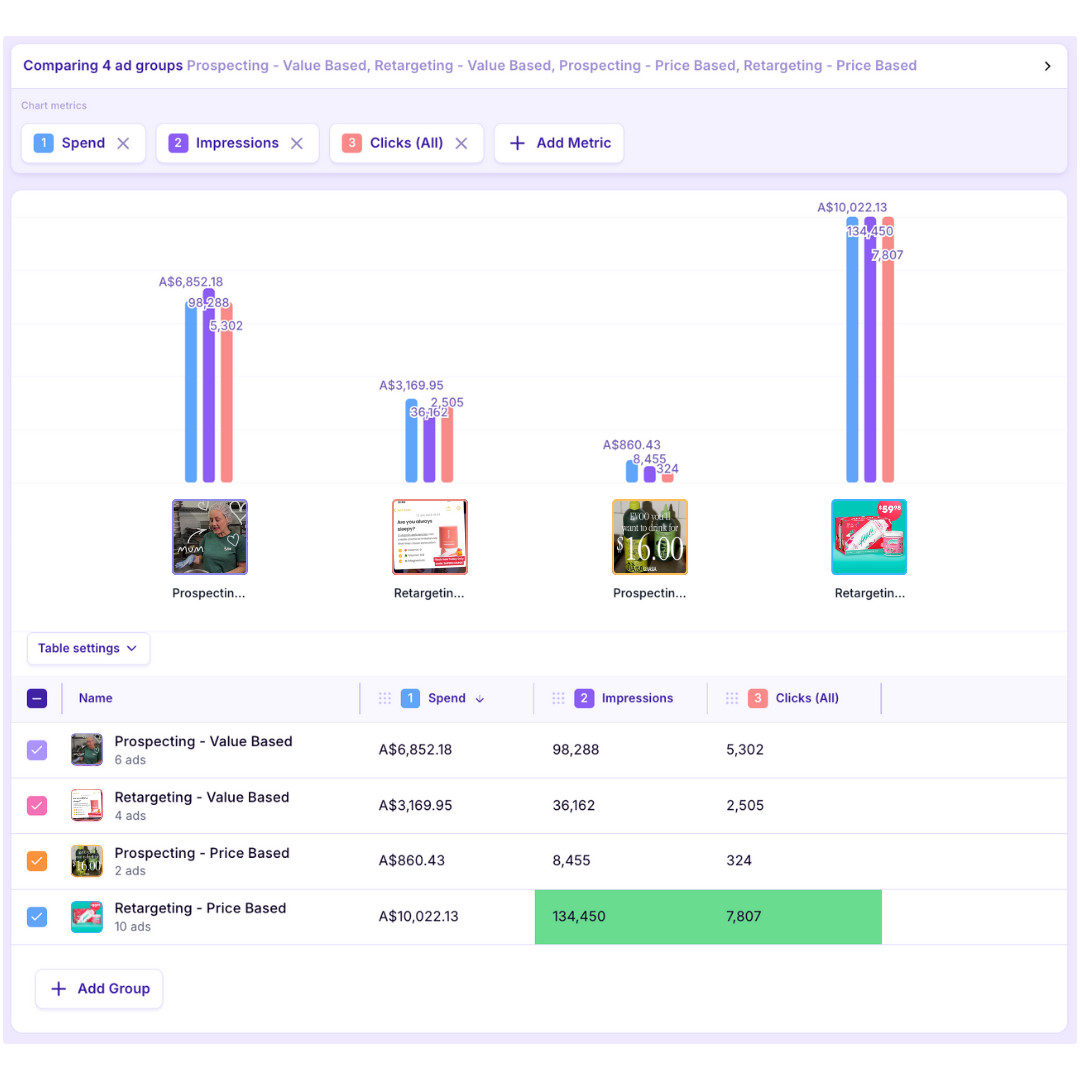
Comparison Reports are helpful for finding broader drivers of creative performance by setting up custom ad groups against your target metrics.
A simple place to start is:
Which formats (video, images, carousels, dynamic ads) drive the best results? (We have a pre-built Compare Formats report in your account for this)
Which creators perform best? (Group > Ad Name > Contains > Creator Name)
Learn more about setting up Comparison Reports HERE
Reports Features & Functions
Learn to navigate the different features and functions inside MagicBrief Reports.
Toggling Between Chart or Card View
In the top panel, click in this top right button to toggle between 2 different views.

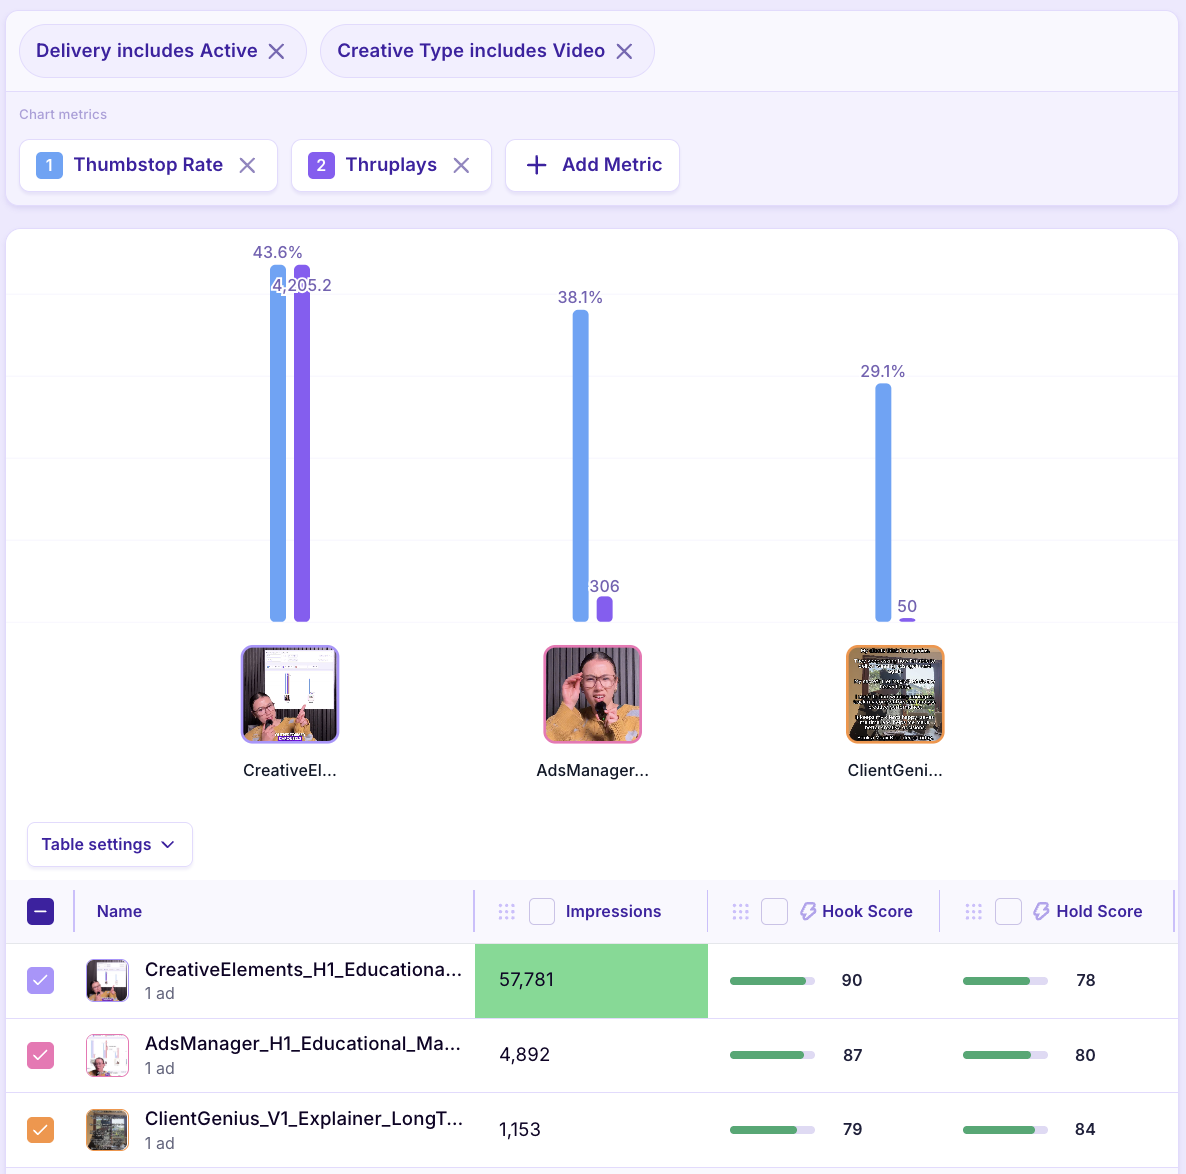
Chart View
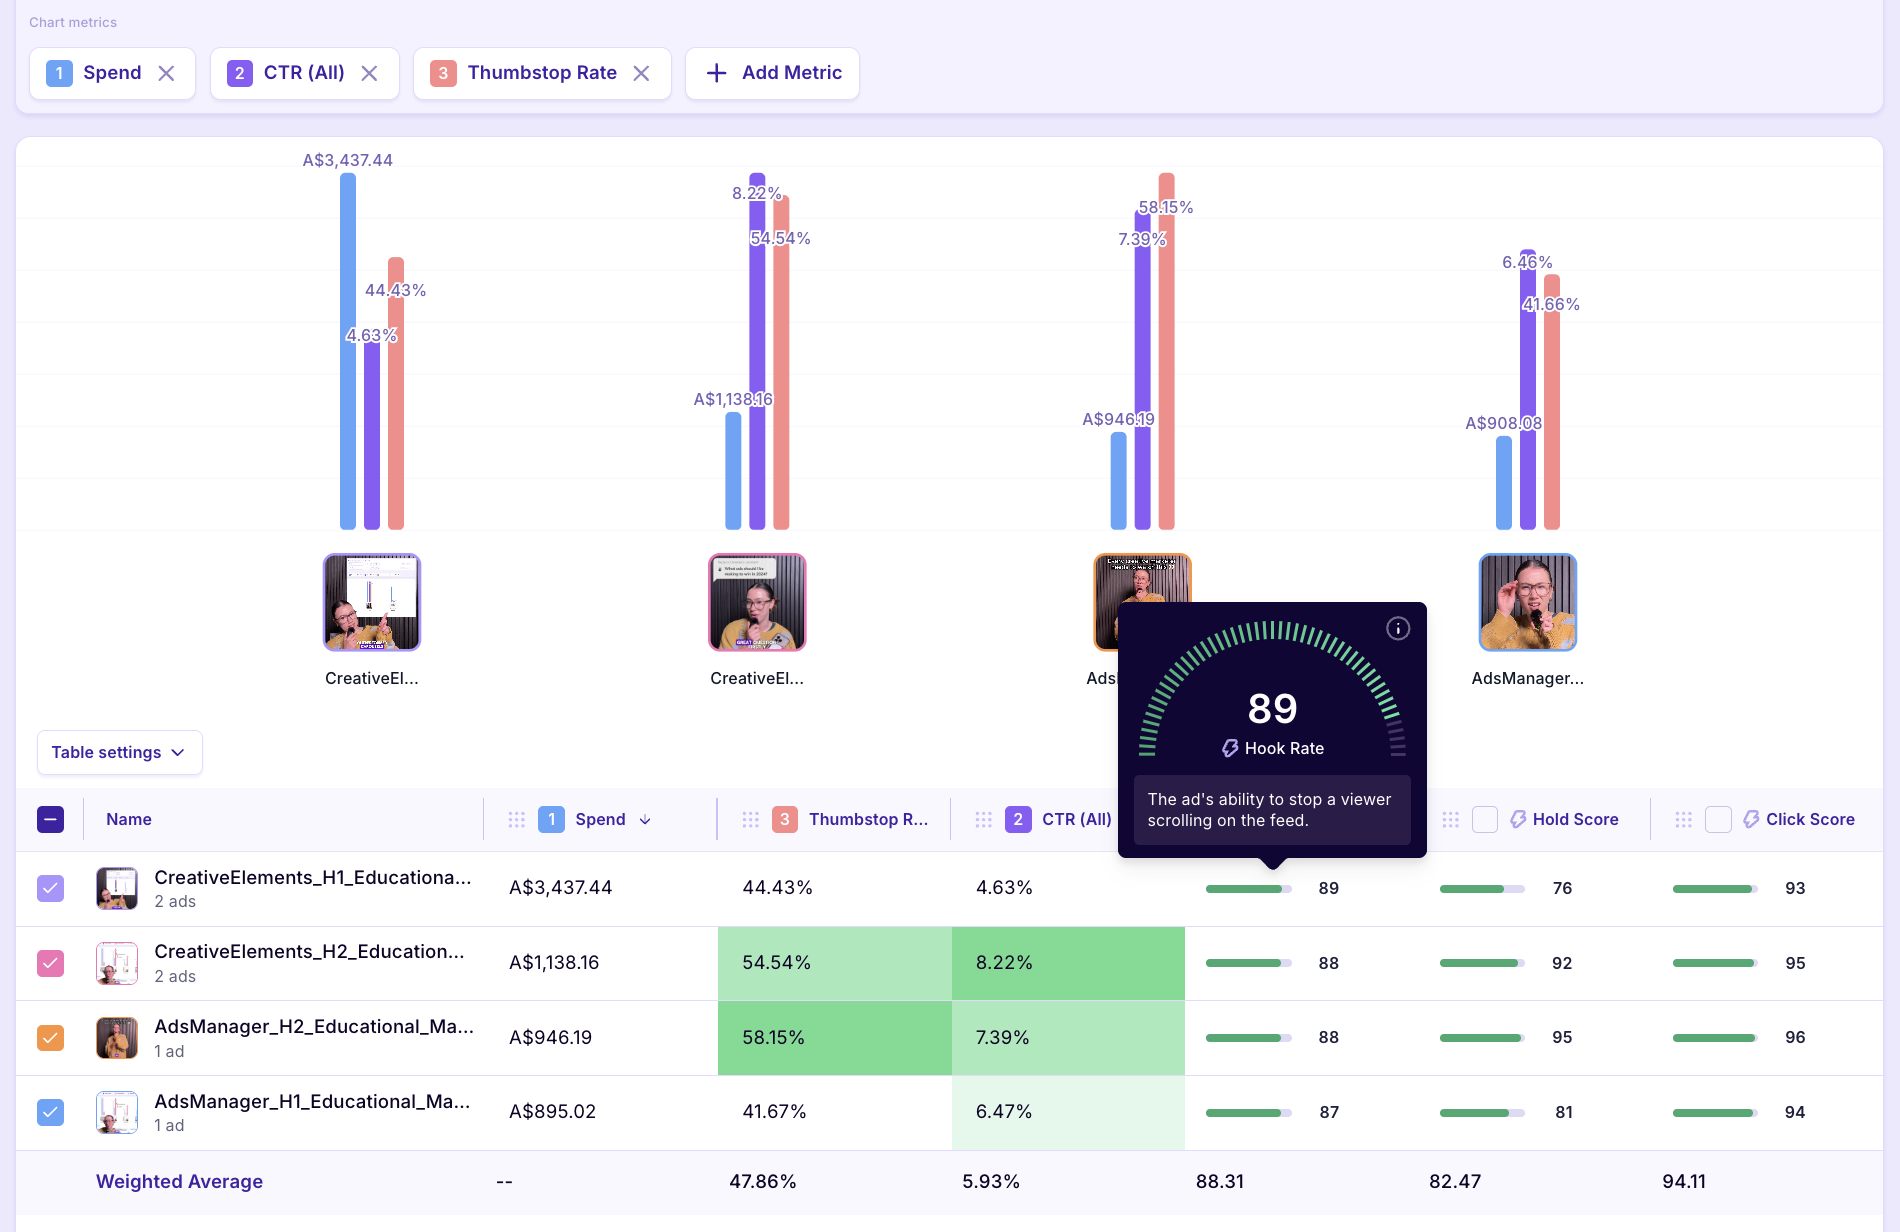
Displays selected metrics in a bar graph view with a table of additional visible metrics underneath, colour coded by performance.
Card View
A view that puts the creative front and centre. Presents ads as separate “cards” with metrics listed underneath.
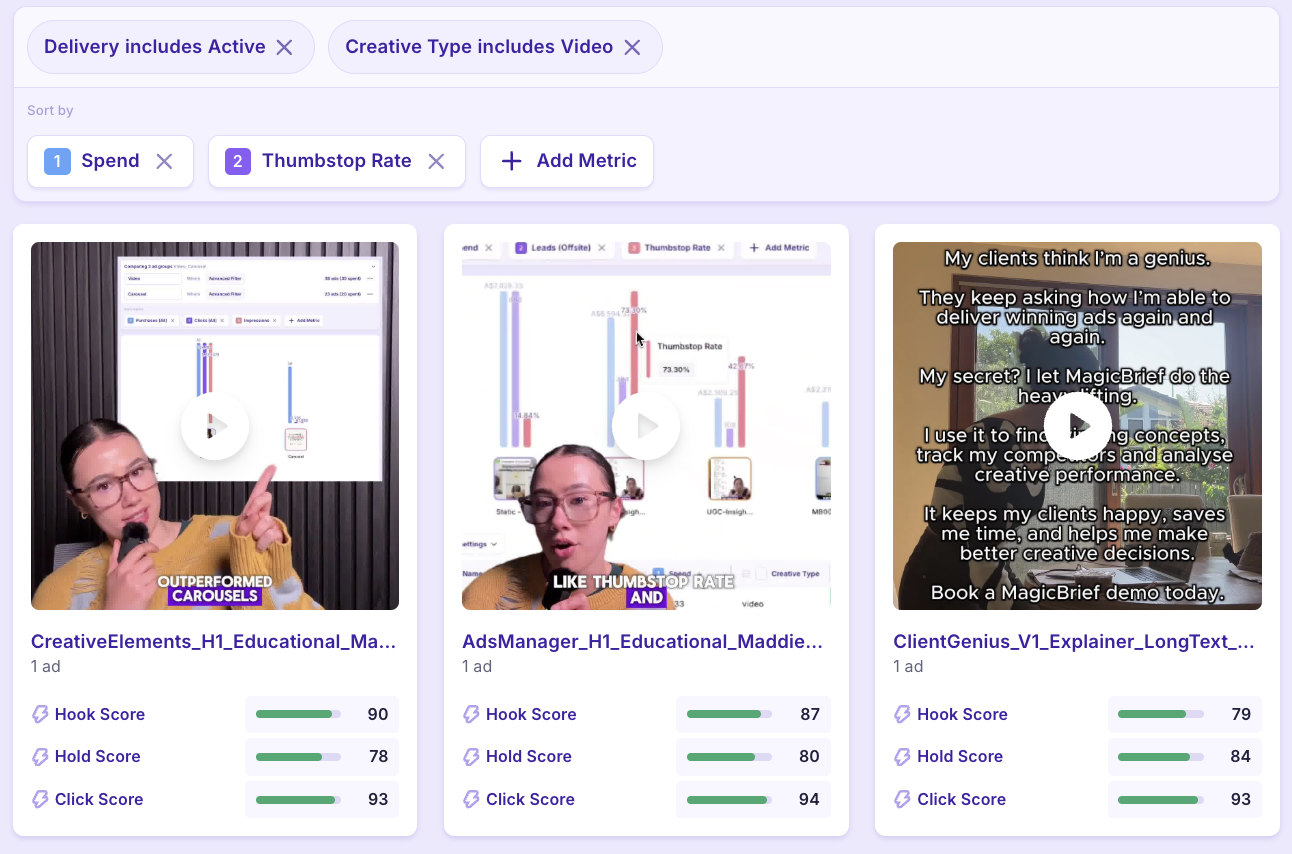
Table Settings
Use the “Table Settings” button in the bottom left of the chart to select the conditional color formatting and add visible metrics into the table.
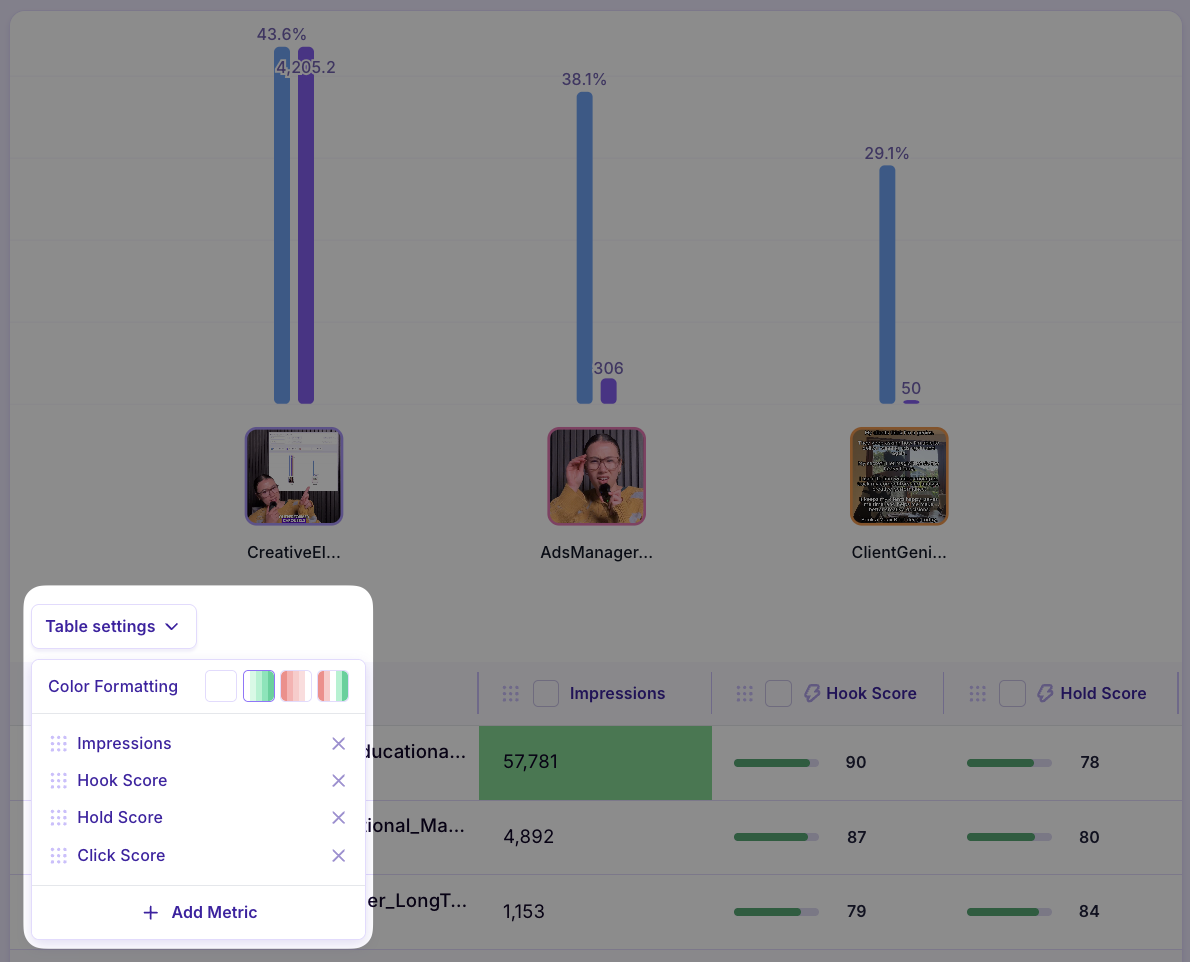
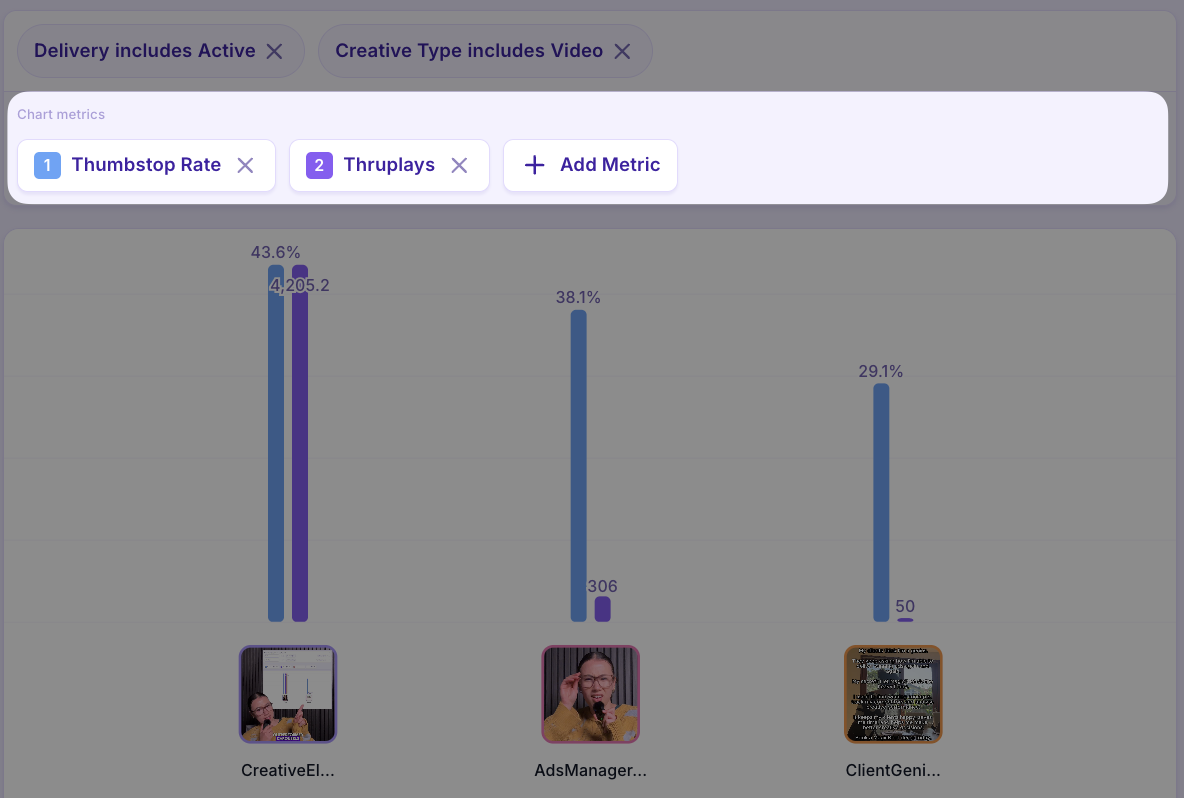
Chart Metrics
When in the Chart View - add metrics to populate in the bar chart below so you can visually see their performance across different ads.
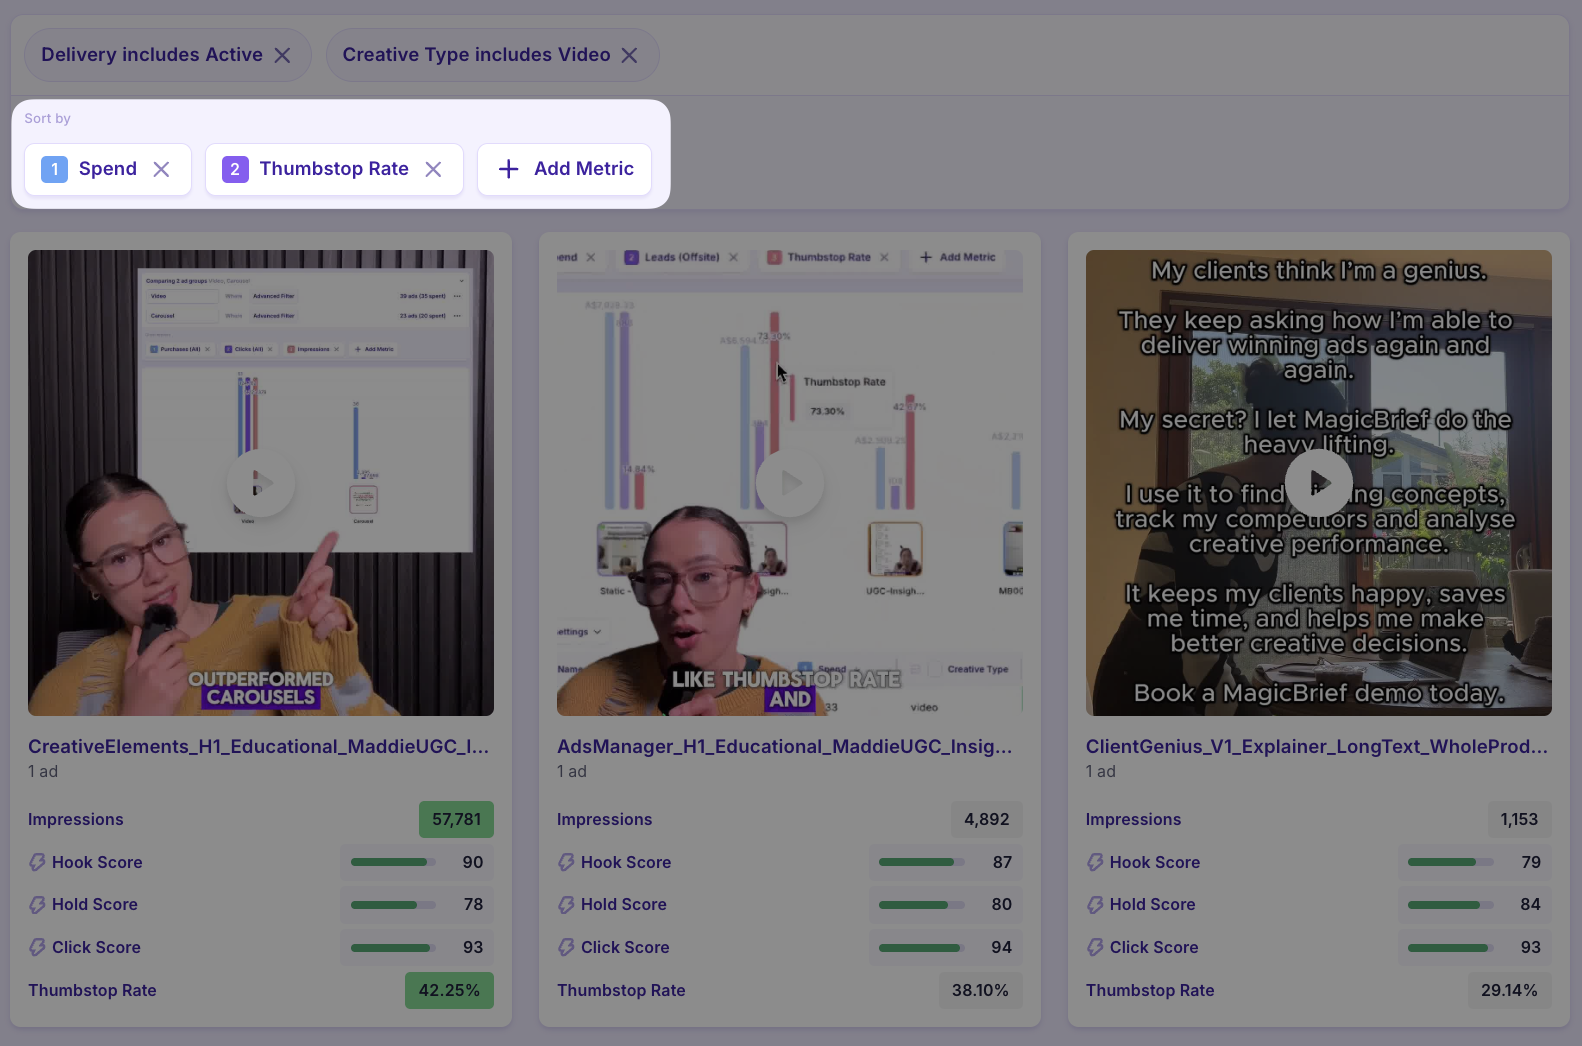
Sort By Metrics
When in the Card View - add metrics to sort your card feed in the order of different performance metrics.
Visible Metrics
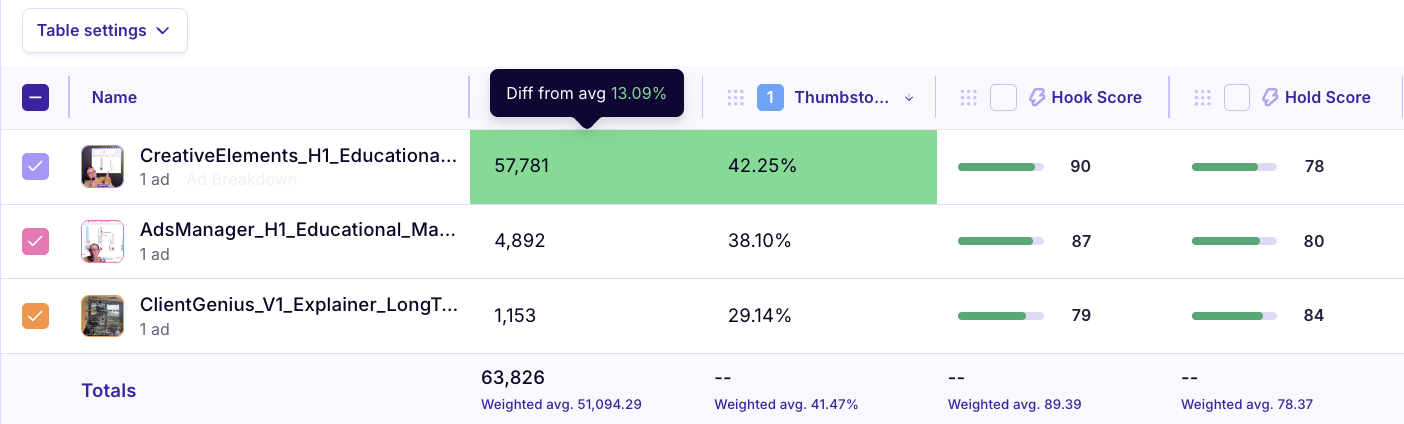
Once you’ve added your chart metrics / sort by metrics, add any additional metrics you may want to have visible during your analysis.

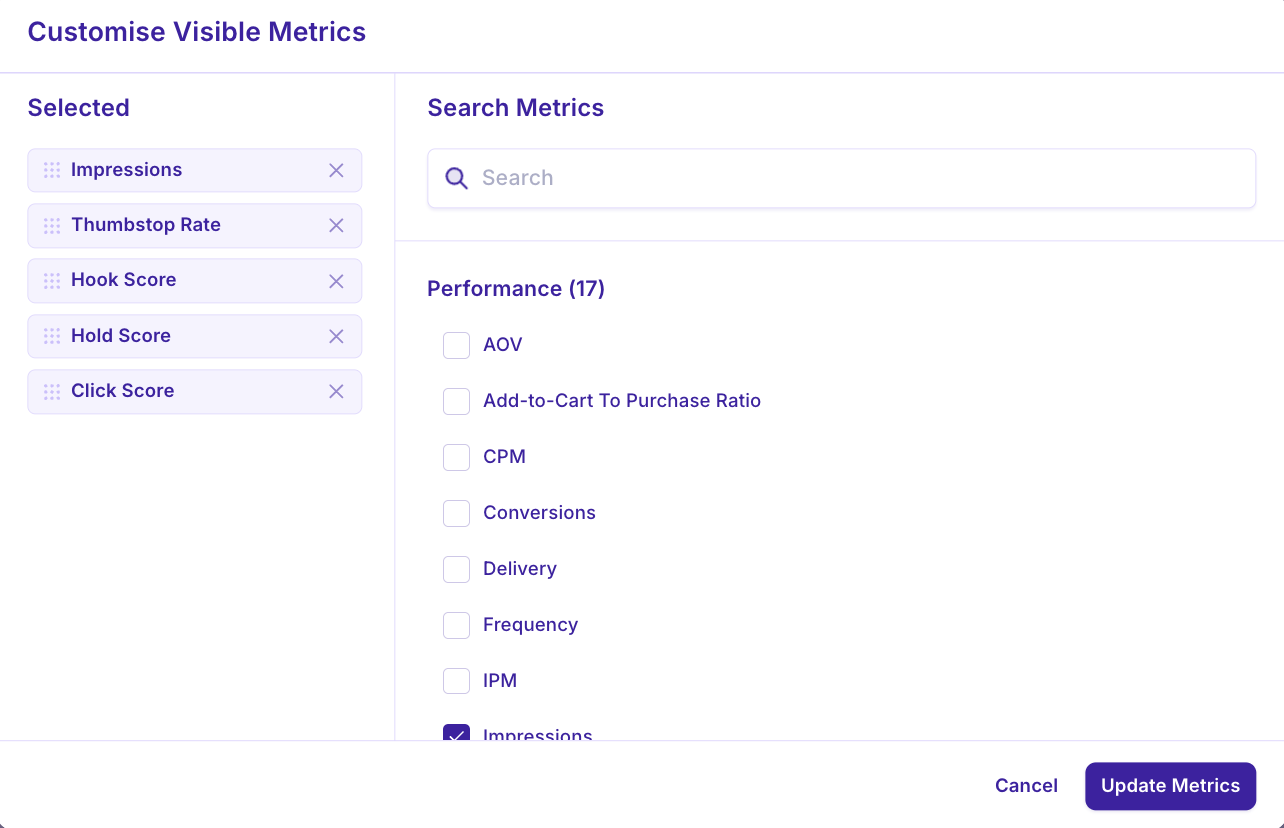
These visible will appear in the table below, but will not impact the chart or sort-order of the ads.
Hover over any metric to see a weighted average score.
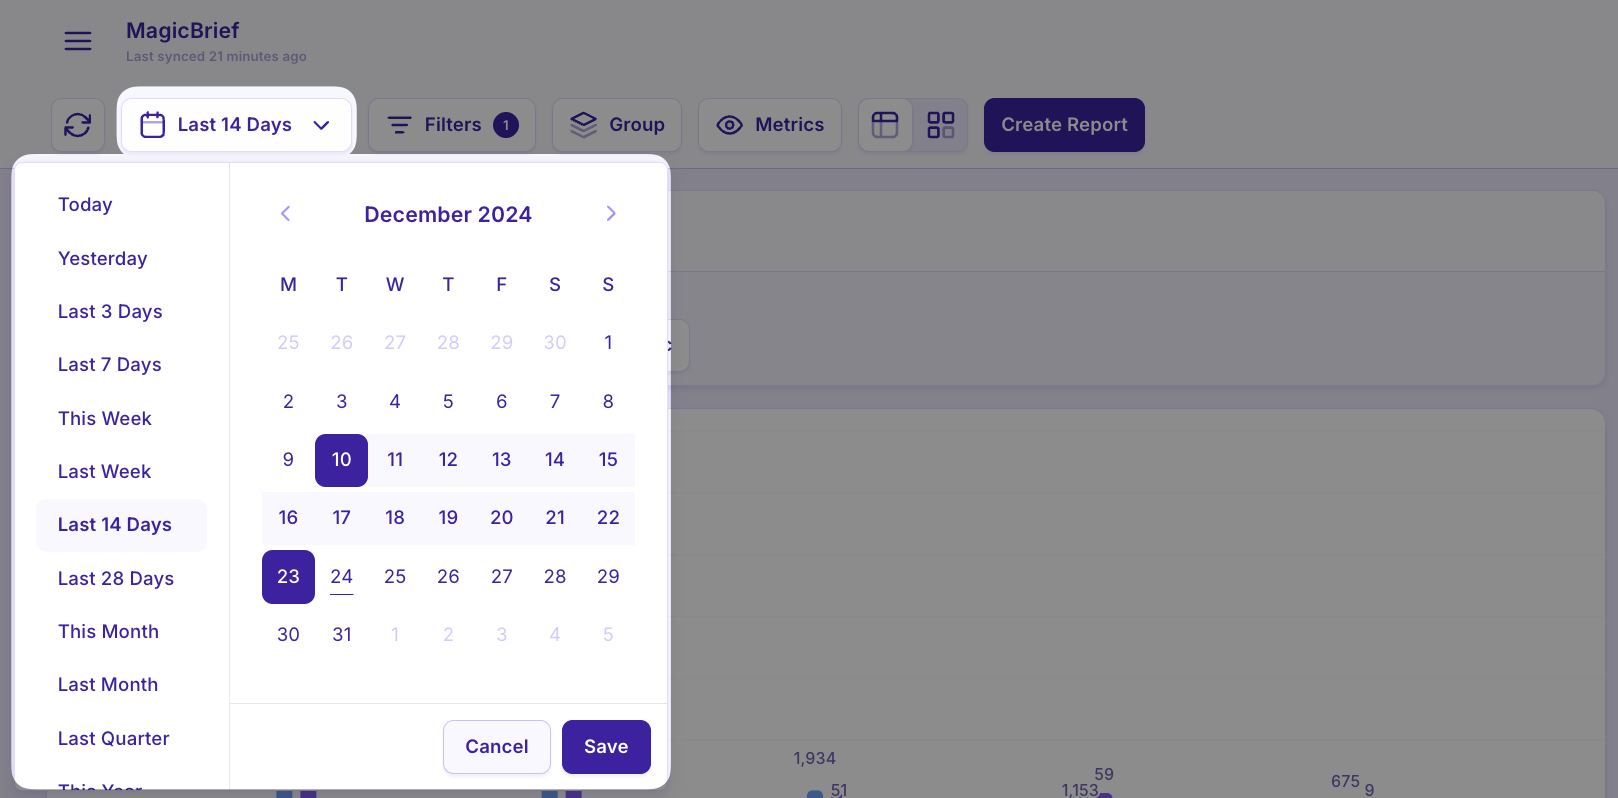
Custom Time Ranges
Set custom date ranges with fixed dates (like June 1st June 12th) or rolling periods (like Last 14 Days). Rolling periods automatically update each time you sync your report.
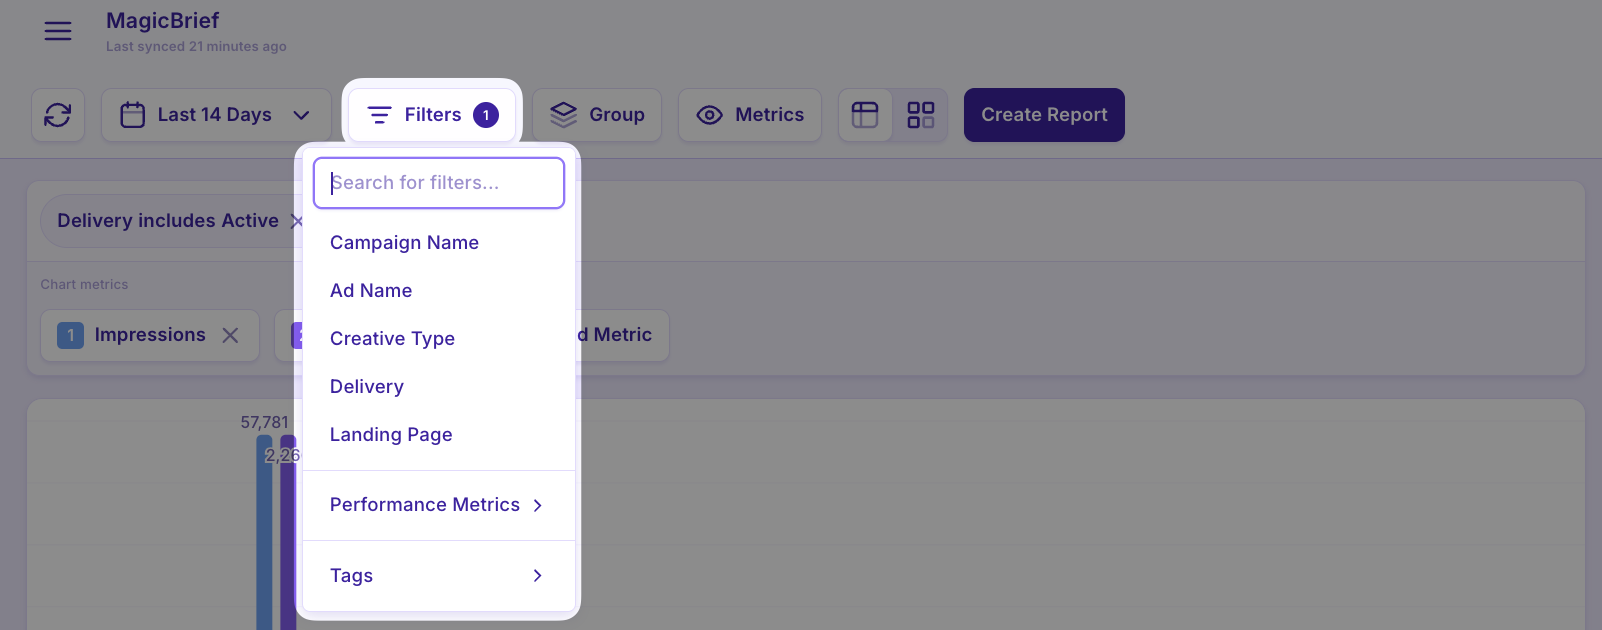
Filters
Add filters to refine your reports by including or excluding different elements.
Filter by different campaigns, metrics, ad name elements, creative type, and more.
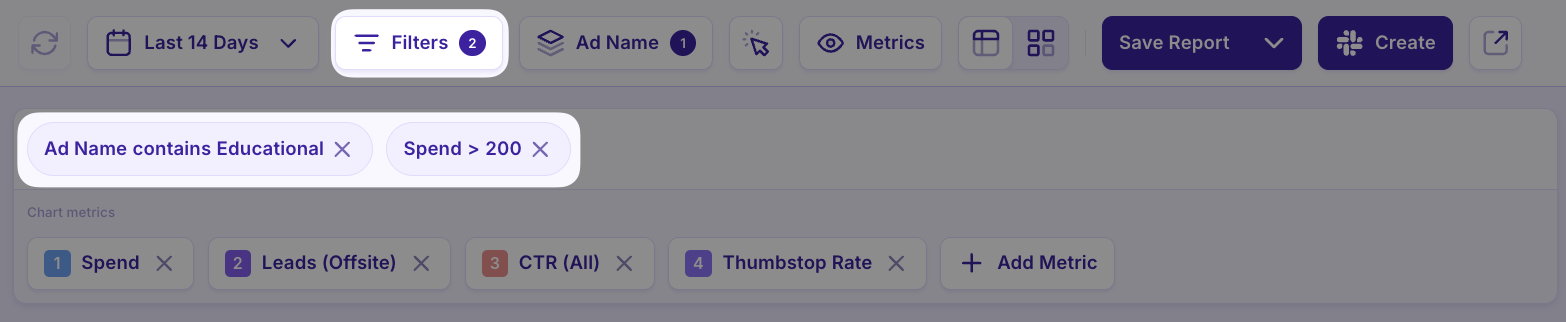
🔮⚡️Magic Tip: Filter by custom tags you create inside MagicBrief to enable deeper analysis without perfect naming conventions. See the help article named Custom Tagging to explore this feature.
Group By
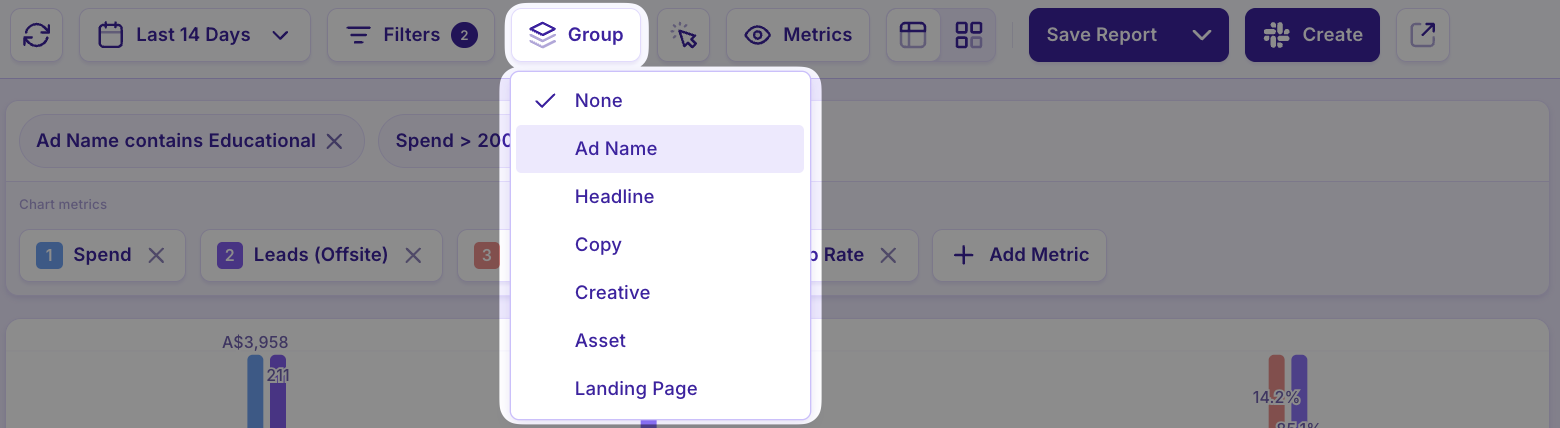
Add Group-By elements to your report to group ads together according to different element.
eg. Group by Ad Name is useful for seeing box 9×16 and 1×1 creative as “one” creative, and group by Copy allows you to see all the ads that used the same copy.
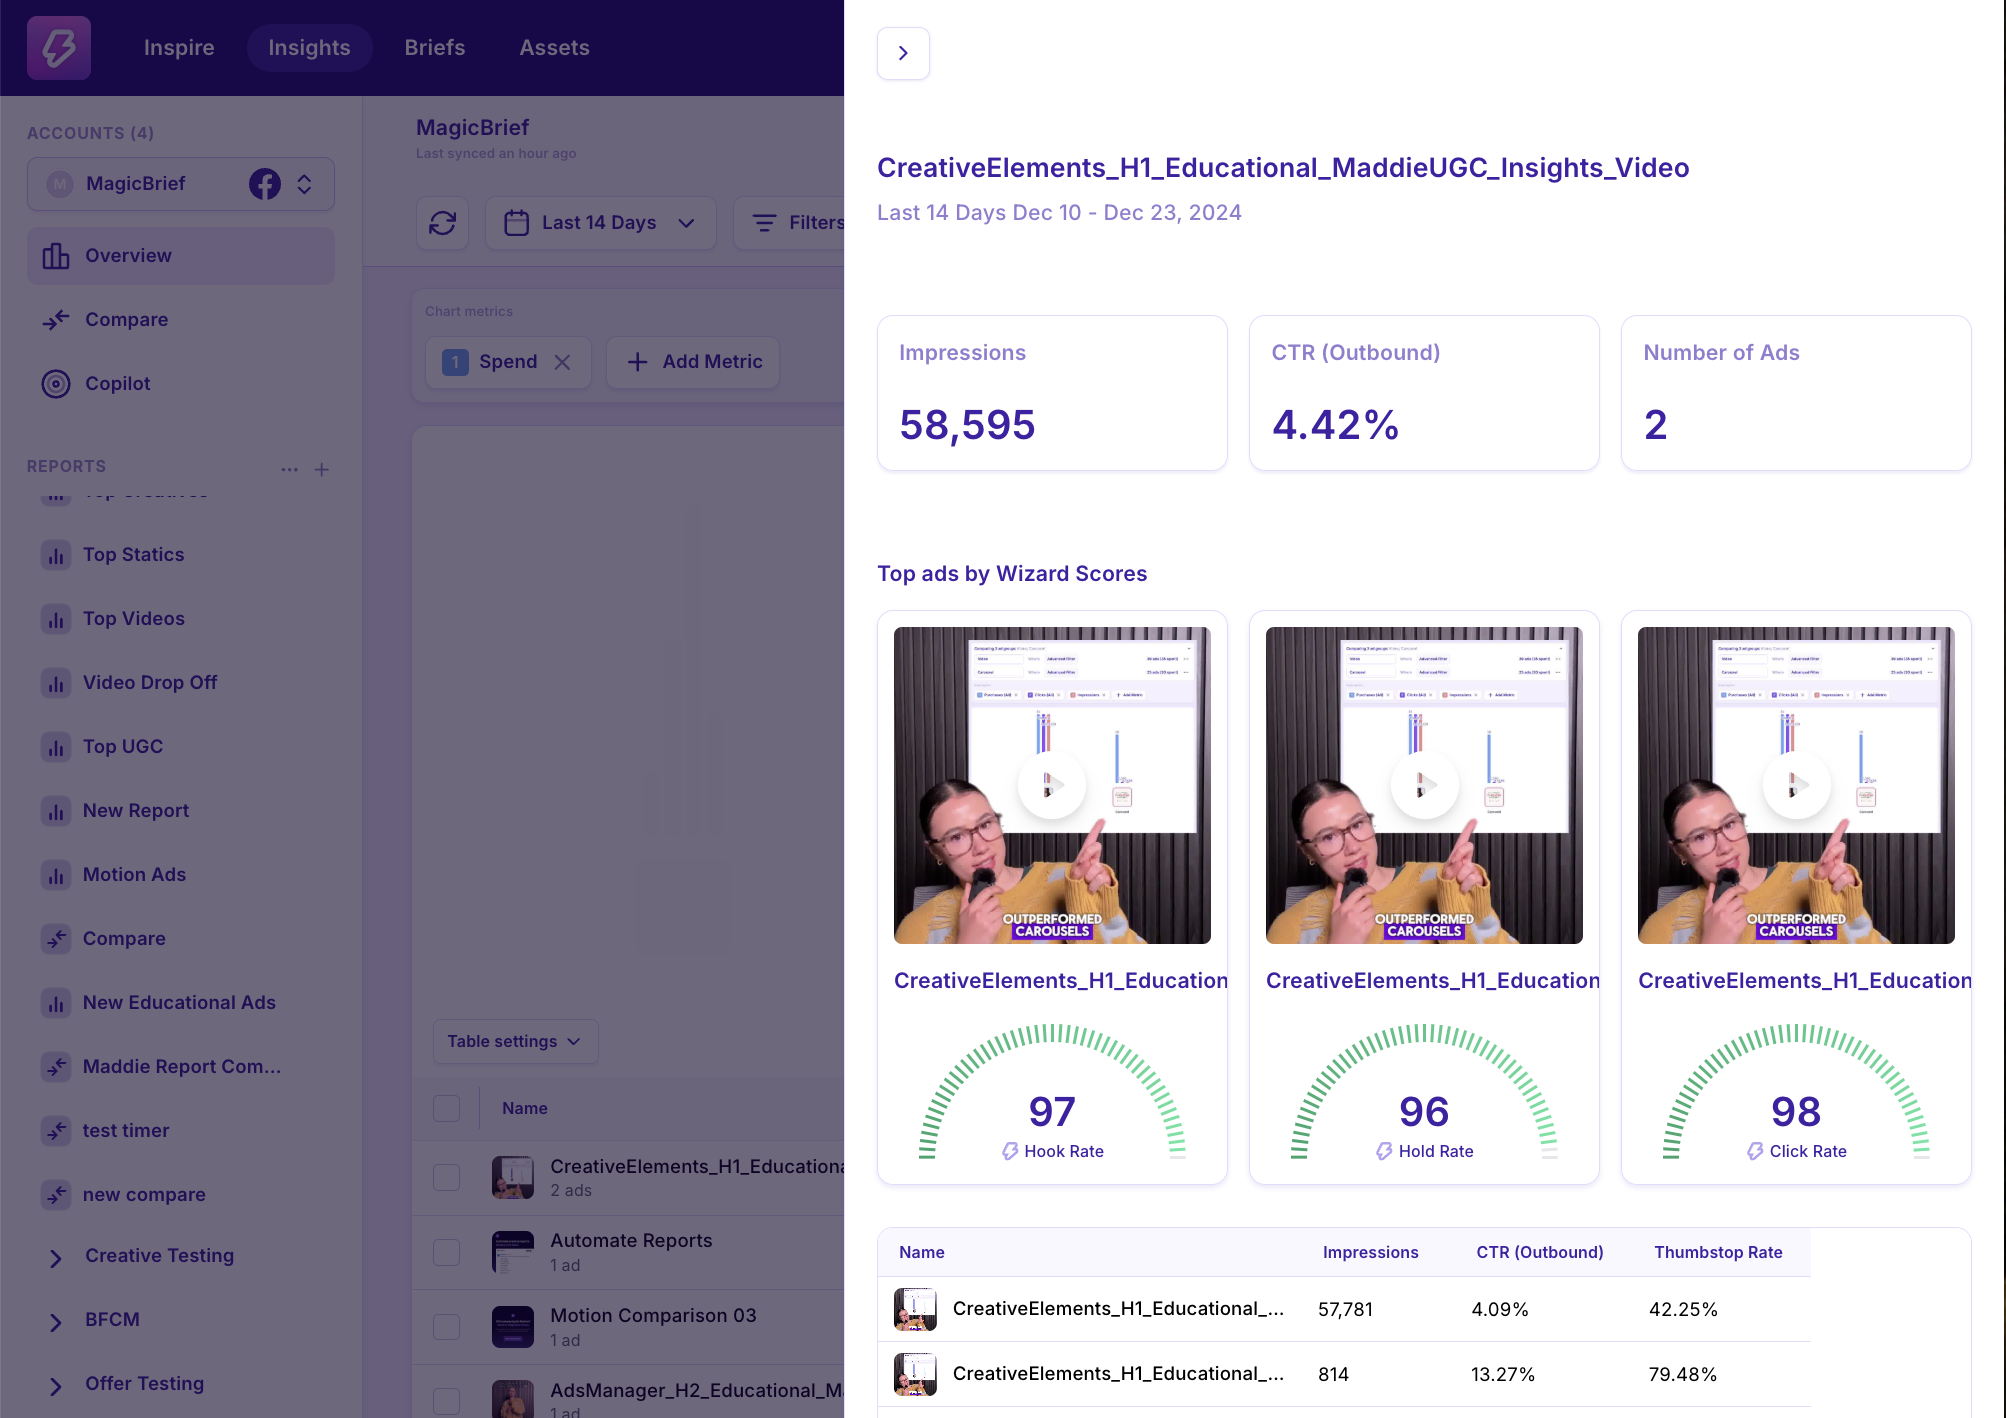
Once you’ve added a group-by - click “ad breakdown” (on the right of a group of ads) to see the performance of ads contained inside that group.
Save & Share Reports
If you would like to make changes to a report after it has been created, make sure you hit “Save Report” to save changes. You can also click “Save As” to duplicate and save it as a new one in your sidebar.
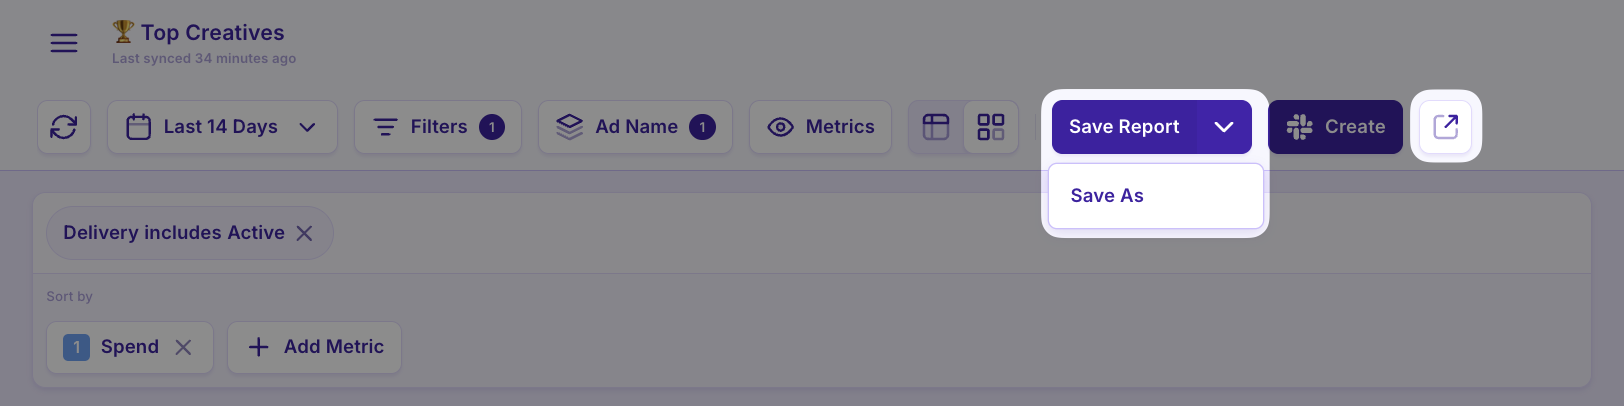
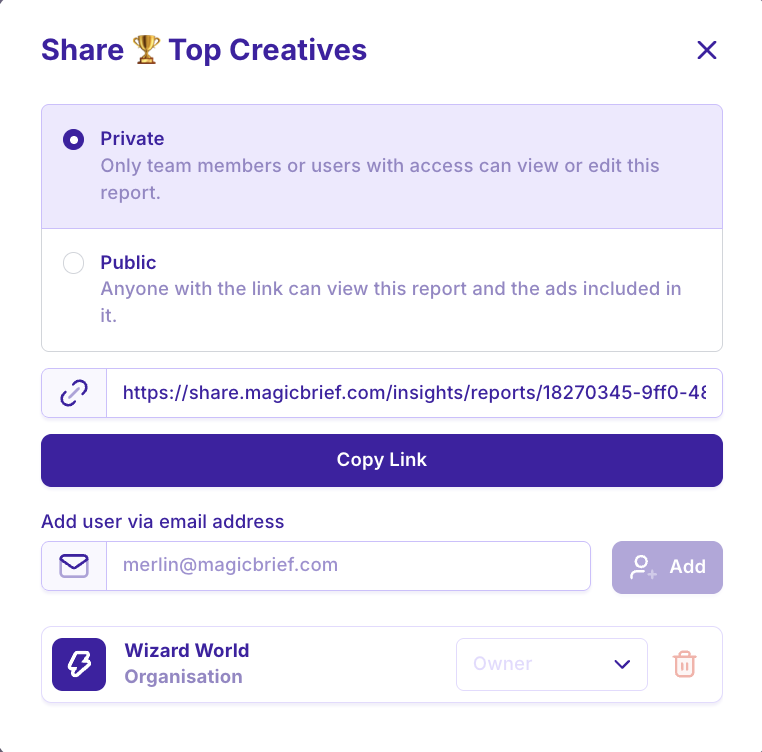
Click the top right share icon to generate a share link.
You can create a private link (to share with those in your workspace) or a public link (to share with anyone even if they don’t have a MagicBrief account).